
Telco Churn Analysis - Part 1 (EDA)
In today’s competitive commercial world, every customer is valuable. Therefore, it is crucial to understand their behavior patterns, including the rate at which they leave a business, known as customer churn. Analyzing customer churn is vital to a company’s success, particularly in SaaS platforms. To understand the customer, it is essential to first understand their churn rate.

To better understand the likelihood of customer churn, I performed a churn analysis on a Kaggle dataset containing customer information from a telecommunications company (Telcom). Before building a classification model to predict customer churn, we need to conduct an Exploratory Data Analysis (EDA) to gain a better understanding of the data.
Goal
Analyze the data of clients of a telecommunications company to predict their likelihood of discontinuing the service, also known as churning, by using machine learning techniques for predictive modeling.
Data
The data used in this analysis was sourced from the Data Challenge DSW 2023 Students & Junior Professional Category.

The dataset consists of 7043 rows, each representing a unique customer, and includes 14 features and 1 target feature (Churn). The data includes both numerical and categorical features, which will be addressed separately.
Target:
- Churn Label (Whether the customer left the company within a time period)
Numeric Features:
- Tenure Months (How long the customer has been with the company by the end of the quarter specified above)
- Monthly Purchase (Total customer’s monthly spent for all services with the unit of thousands of IDR)
Categorical Features:
- Customer ID (A unique customer identifier)
- Location (Customer’s residence - City)
- Device Class (Device classification)
- Games Product (Whether the customer uses the internet service for games product)
- Music Product (Whether the customer uses the internet service for music product)
- Education Product (Whether the customer uses the internet service for education product)
- Call Center (Whether the customer uses the call center service)
- Video Product (Whether the customer uses video product service)
- Use MyApp (Whether the customer uses MyApp service)
- Payment Method (The method used for paying the bill)
Exploratory Data Analysis (EDA)
Data Review and Cleaning
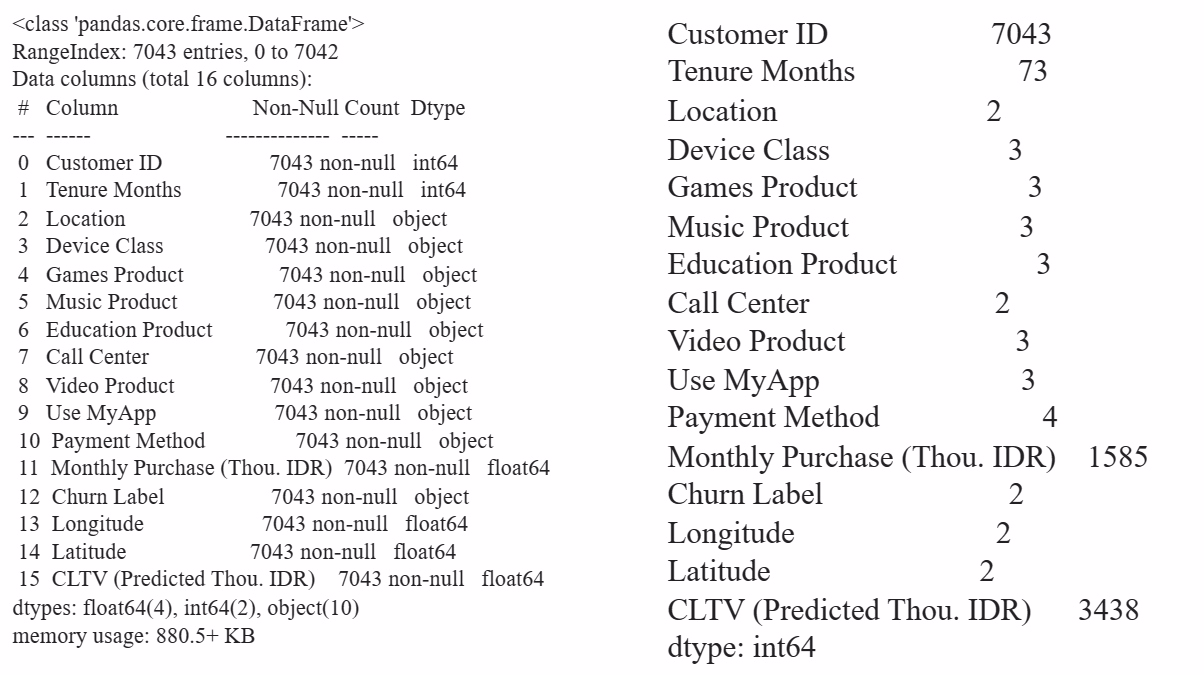
The dataset is devoid of missing entries and does not exhibit extreme values in terms of its cardinality, ensuring its completeness and balanced distribution for reliable analysis.
Data Visualization
Customer Churn
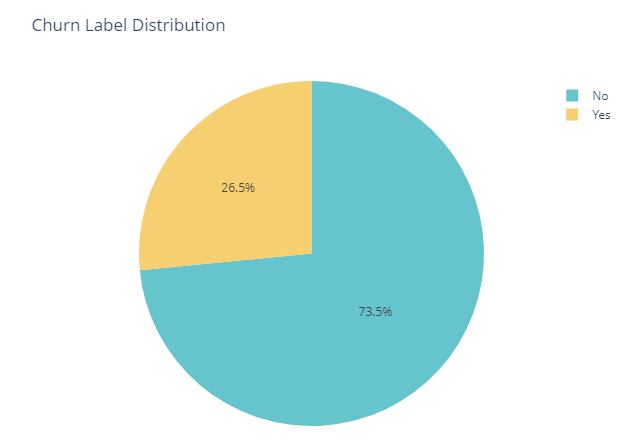
We can see from the pie chart, about 26.5% of the Telcom customers from our dataset end up churning. Although this may seem high, as I do not have prior telecommunications experience, I will refrain from making any assumptions. Churn will be used as a variable in most of our exploratory data analysis since it is our target variable.
Tenure Months
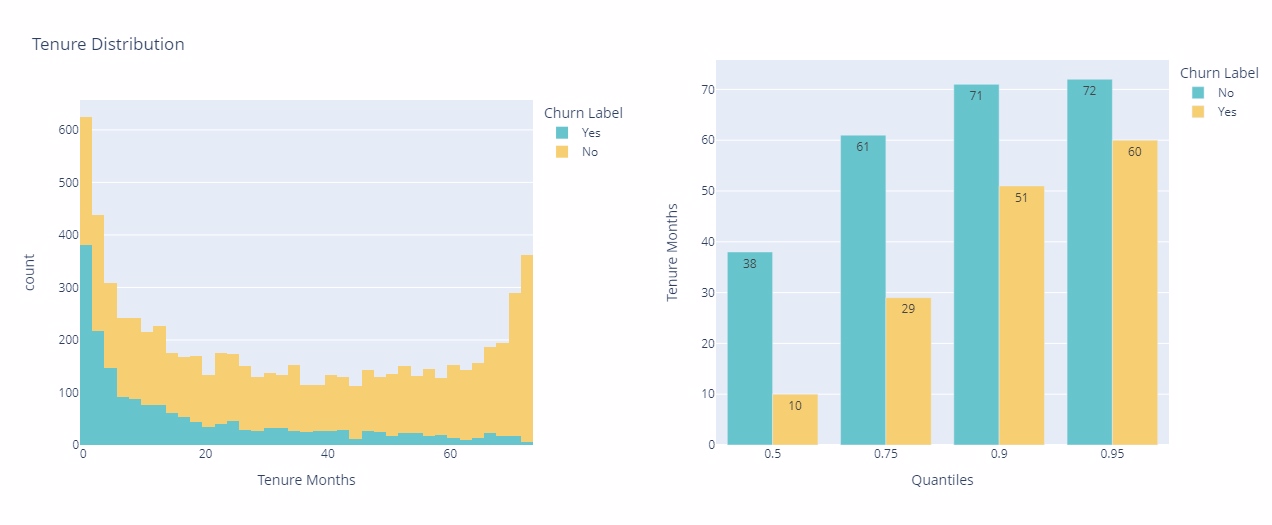
Upon analyzing the data, it is evident that there is a significant correlation between the decrease in client churn and the duration of their service. The rate of decline in churned clients stabilizes notably after the initial five months of service. Additionally, approximately 50% of customers choose to leave the service within the first ten months. Early intervention and proactive measures are critical to mitigating churn, especially during the initial phases of customer engagement.
Monthly Charges
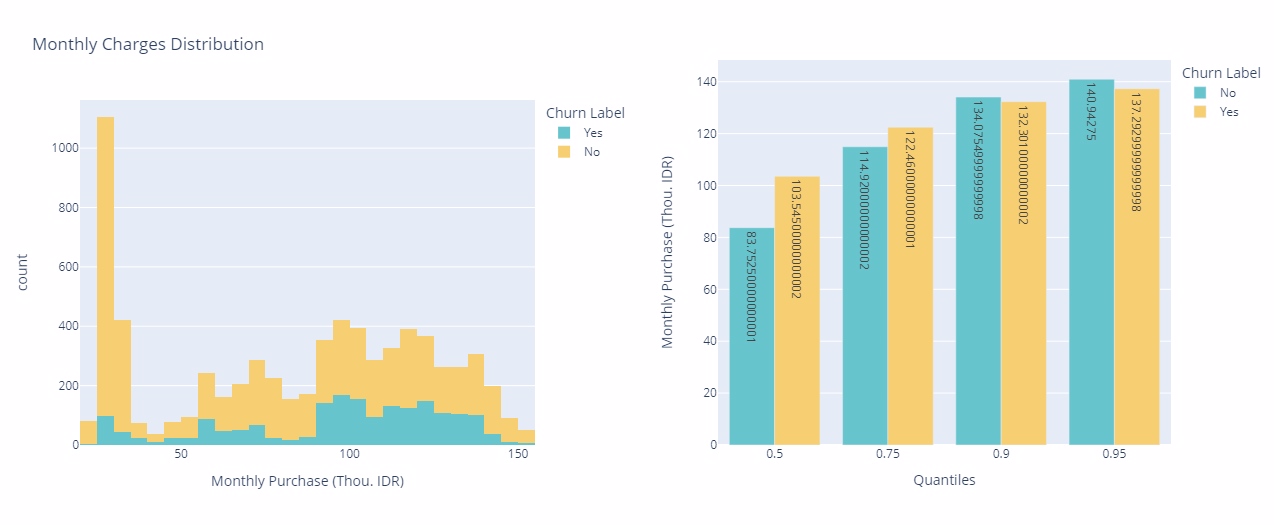
Clients who cancel their subscription tend to have monthly expenses over $60. Additionally, around 50% of customers who leave terminate their service within the first $103 of charges. This indicates a correlation between higher monthly expenses and a higher likelihood of churn, with a significant proportion opting out early in their billing cycle. Understanding spending patterns can provide valuable insights for retention strategies and pricing optimization within the telecommunications company.
Location
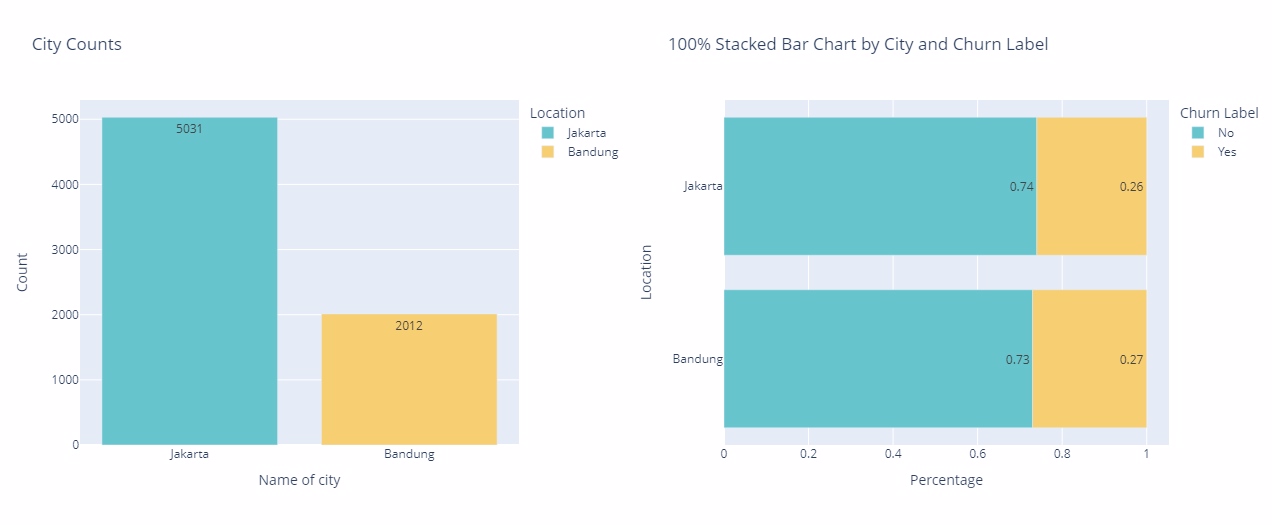
Jakarta has the highest concentration of customers, totaling 5031, followed by Bandung with 2012. Despite their differing customer volumes, both cities exhibit a comparable churn rate, with Jakarta at 26% and Bandung at 27%. This suggests a similar pattern of customer retention challenges in these two urban centers, warranting further investigation into the underlying factors driving churn behaviors across different demographic regions.
Device Class
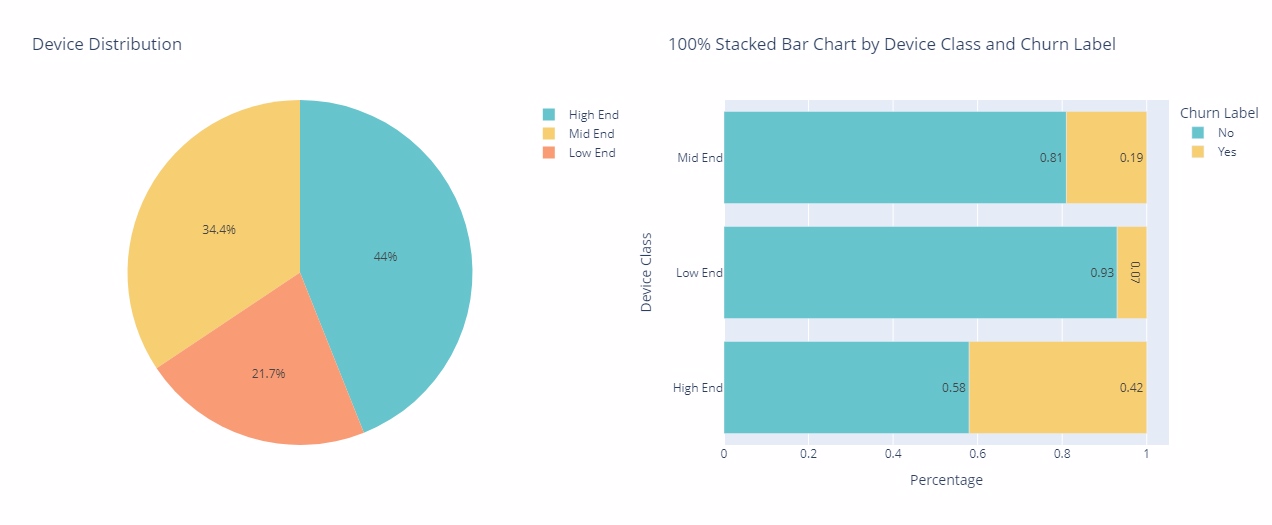
High-end device users have the highest churn rate at approximately 42%, while low-end device users have the lowest churn rate at only 7%. Despite this, around 44% of customers opt for high-end devices. This correlation highlights the importance of device type in influencing customer churn behavior and suggests potential avenues for targeted retention strategies tailored to different device segments.
Payment Method
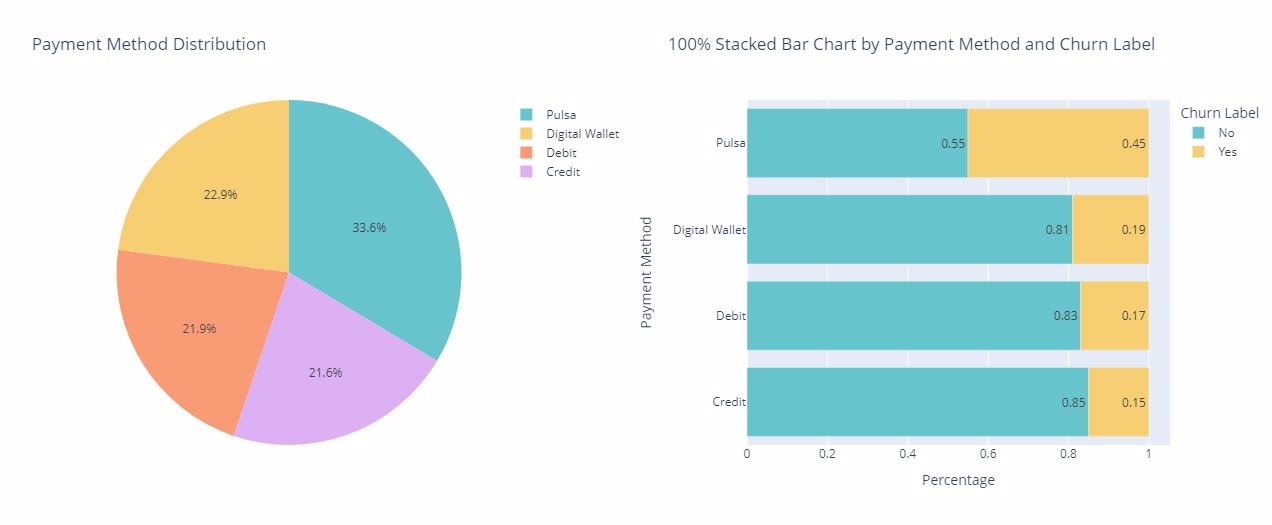
Approximately 33.6% of customers prefer Pulsa as their payment method. Interestingly, these Pulsa users have a higher churn rate of 45%, while those who choose credit have the lowest churn rate at approximately 15%. There is a significant correlation between payment method and churn rate. Pulsa users have a higher tendency to discontinue service compared to credit users.
Device Class & Payment Method
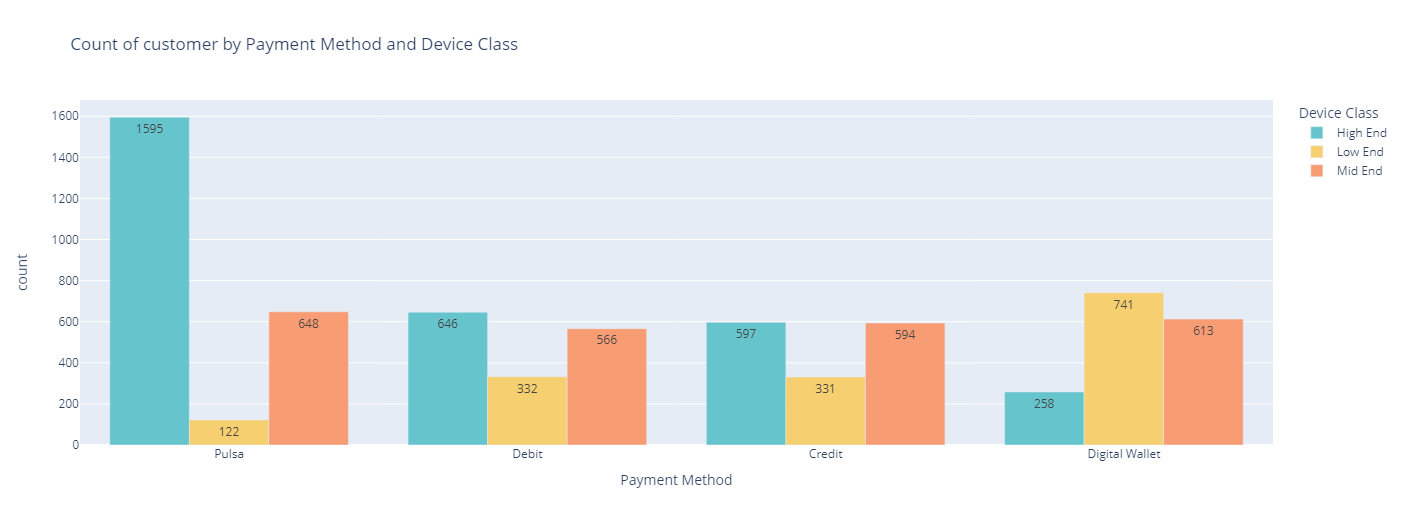
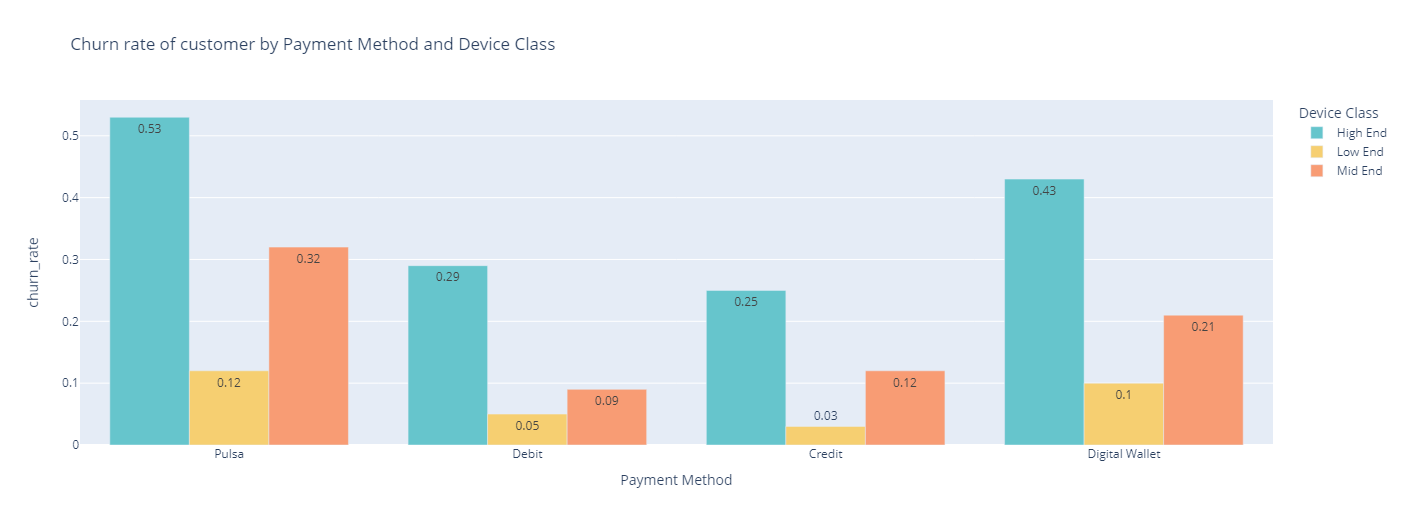
Out of the total number of customers, 1595 utilized the ‘Pulsa’ payment method and owned high-end devices, which was significantly higher than the number of customers with no internet service, which was only 122. It is worth noting that there is a significant difference in churn rates between high-end and low-end devices, especially when using ‘Pulsa’ and digital wallets.
Conclusions & Recommendations
Here are the conclusions and recommendations for dealing with customer churn in the telecommunications industry, presented in the form of bullet points:
Conclusions:
- The dataset is complete and balanced, with no missing entries or extreme values, ensuring reliable analysis.
- From the analysis, several relevant patterns regarding customer churn were found:
- Tenure, or the duration of service, has a significant correlation with churn rate. This correlation stabilizes notably after the first five months.
- Higher monthly charges are more likely to result in customer churn, particularly at the start of the billing cycle.
- The churn rate is not significantly affected by geographic factors, such as the location of customers.
- Customer churn behavior is significantly influenced by the type of device (device class) and payment method used.
Recommendations:
- Implement retention strategies early in customer engagement to reduce churn.
- Analyze customer spending patterns to understand their preferences and behaviors. This information can be used to optimize prices and develop retention strategies.
- Further investigate factors that may impact churn across different demographic regions.
- Develop retention strategies tailored to customers’ device and payment preferences.
- To enhance the effectiveness of retention strategies, it is important to strengthen the understanding of the relationship between monthly charges, tenure, and churn behavior.
- Utilize data analysis insights to identify patterns of churn and take necessary preventive actions, such as adjusting services or offering special deals to customers who are at risk of churning. Implementing these recommendations can reduce customer churn rates and improve retention, positively impacting business performance and growth.
Please Note: To access the code, please refer to my GitHub repository. Thank you.